
A few months back I spoke at Tai Lopez’s house to a private group of individuals looking to scale their crypto currency investments. The general question that they wanted to be answered was regarding “how to analyze a crypto currency.” There are two basic principals; fundamental analysis and technical analysis…we will cover both.
Be warned; the example that I am going to provide in this article is from an analysis that I did just 24 hours before making this post. The chances are that if you are reading this article within just weeks of me publishing it, you could still act on this trade and set yourself up for some good gains….and if not, you will at least know how to set yourself up for future gains in crypto currency!
What Is Fundamental Analysis?
When you are investing in anything; stocks, futures, ETF’s, mutual funds, securities, or in this case crypto currency you must first look at the market on a fundamental level:
- What is going on in the world as it pertains to this asset (crypto currency)?
- Does the currency appear to be at a higher value relative to its history, or a lower level? Why is it higher? Why is it lower?
- Does this crypto have a good use case (does it have a MAJOR application that it is currently being used for)?
- What is the general opinion of it (you must separate the bullshit from the facts; media likes to talk shit because it gets them publicity)?
- Take all this into consideration and look at the chart, look at the history and use the fundamentals to start shaping an opinion.
You see, it is very basic, it is simply fundamentals. Next we are going to look at technical analysis, then I will show you the actual chart I have analyzed for you, and we will formulate a conclusion as to what is likely to happen with this coin.
What Is Technical Analysis?
Now you can’t rely JUST on fundamental analysis. You need to be able to really reach in to the charts and start deciphering the human emotion, action, and reaction….There was actually someone who argued with me at Tai’s place saying that TA was a bunch of bullshit and here is why he said that; In technical analysis (TA) we look at charts, we look at patterns, we look at how the coin goes up and down in value and we start to draw patterns from it. His argument was that, “you can’t say well this went up here, and then it went down and formed a triangle and then bounced twice on this line and because it did all that now we know what it is going to do next.”…and to that I say this: Well…buddy, the reason the chart does that and the reason that technical analysis is completely valid is because humans aren’t that fucking complicated. They buy low, they sell high, they get impatience and they sell out lower than they wanted, they get scared when shit goes down so they sell out of fear of losing more, they make mistakes, they make good moves, etc…and it is because of that that these patterns in technical analysis occur. So what is the end result?..Well if we have played our cards right then we have compiled the basic information and conclusion from our fundamental analyis with a technical analysis that further supports the fundamentals.
So now let’s look at a chart!!!
Analysis Of A Crypto
First off, I want to tell you that fundamentally OMG has excellent support and development. One of its leaders is Ethereum’s lead developer and founder; Vitalik Buterin. OMG is working to provide a paperless banking solution to Southeast Asia. OMG is based out of Thailand and to this point it seems to actively be gaining support in utility use from a large population of unbanked individuals located in Southeast Asia.
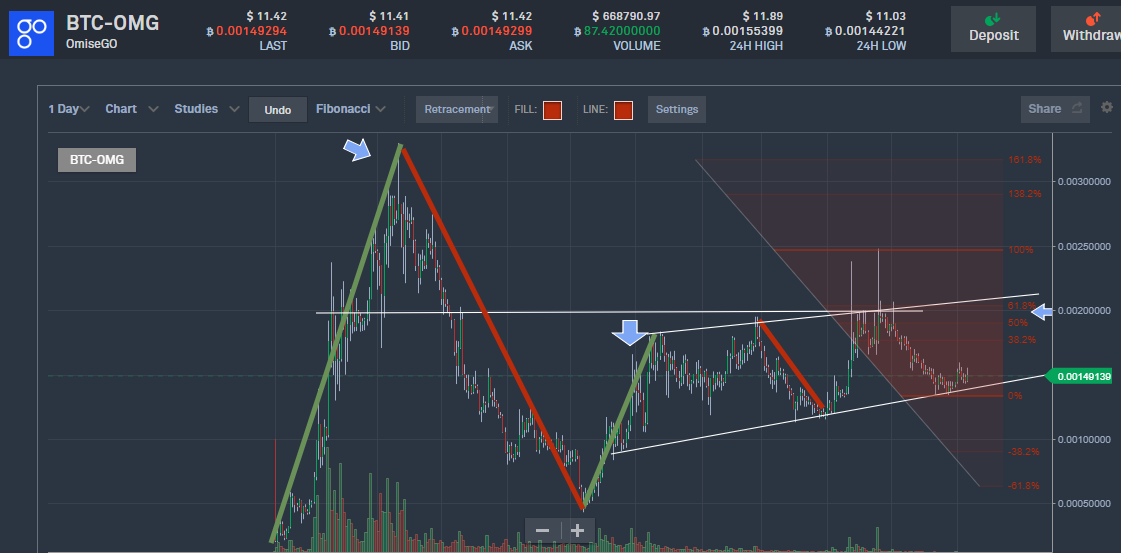
On the chart we can see that from a fundamental standpoint the coin is currently at a lower entry than its 4 bull markets (bull meaning that the coin went up in value). We are looking at a chart where each candle is 1 day. The beginning of this chart starts in July of 2017 and goes up to June 7th of 2018. The green/red lines that I drew indicate the bull/bear trends (green for bull and red for bear). The arrow on the top left is the most significant market of this coin which was in September/October of 2017 and NOT in Dec of 17 to Jan of 18 (when most cryptos were on a bubble). To continue on, the coin sustained higher than its current level after its second bull market (second arrow) which was during the bubble; so you would think that the currency would have gone down like most everything else after January of 2018; but it didn’t. Instead it has found support….
Note the ascending white lines on the right half of the chart (one on bottom and one on top). Notice that the highs are getting higher and the lows are also getting higher; this indicates that the trend for the last couple months in this coin is that it is gradually going up in value. This pattern is called an ascending wedge; where we get at least 3 points on the top/bottom line and 2 on the other line (bottom or top).
Okay so now we know a few things; off the chart and out in the real world this coin seems to have a good use case, is receiving support, and is solving a big problem in a big economy. On the chart we can see from a fundamental level that this asset has had no problem in the past being worth considerably more than it is now; in 4 markets to be exact. We can see its bull markets, its bear markets, and the formation of what appears to be turning into an ascending wedge pattern. If you look closely you will also see that it appears that in the last few days the asset is going upwards towards the top line of the ascending wedge.
Let’s dive a little deeper to form our final analysis. Notice the horizontal white line that I have drawn. Do you see how it struggled to cross that line in its first bull market, and struggled to fall below in its first bear market? And do you see again how it approached this line, failed, went down, approached it again, failed, went down, approached it again, bounced along it, then failed once and for all? This white line becomes a noteable point of reference. It seems to be an area where people are purposely selling; the market is either always being driven up by buyers to this price, where they are met by a significant volume of sellers looking to sell at that price, or the market is being sold down hard when the sellers drive the market down to this level and then finding support by more buyers once it reaches this level. To validate this possible pattern we are going to use the Fibonacci tool…
The Fib tool is a system of numbers seen throughout nature, is used in math, and is used by senior traders, analyists, financial advisors, stock investors, mutual fund managers, in forex, and other financial markets. These Fib levels are were traders will historically choose to place their sell orders. What we do to set this Fib tool up is we place the top of it at the most recent market high and the most recent market low. You will see the red numbers with corresponding horizontal lines. 38.2 and 61.8 are notable Fib levels. It it a coincidence that the 61.8 Fib level is hitting right where I drew that white horizontal line?…No, it is not, because we have done our analysis right and used the Fib tool to validate our analysis.
So in conclusion it appears this asset will be going up in value; likely to reach the 61.8 level very soon and creating a good selling opportunity at the 0.002+/- level (25% higher than its current level). Reasons to suppor this evaluation:
- It has had 4 markets significantly higher than its current level
- Ascending wedge appears to be forming (lows are getting higher, highs are getting higher)
- It appears that the asset has turned bull recently and is approaching the top of the ascending wedge
- The asset appears to have no trouble receiving support up to the 61.8 Fib level
- Fundamentally OMG has great purpose, utility use, and is solving an economical problem
This article is simply shown to provide you an example of what MAY happen. I am not a financial advisor; what you choose to do with this information is up to you. Some of you will make more than me with less, some will make less with more, and some will make the same.
…But then again, what does a financial advisor know? You work for Edward Jones?..Oh that’s cute. To learn more and start making gains I highly recommend that you join us in Millionaire Mafia!
Thanks for reading!